

C-Cell produces over 50 measurements per analysis, these are broken down into the following sub-groups to determine product quality in bread.
Colour
Dimensions
Shape
Cell Size
Elongation
Inclusions
External features
Bread score
Many bakeries select 5-8 results that best differentiates their product quality.
Colour
L*a*b* Colour results are available with C-Cell Colour. Data such as average crumb colour, external crust colour and brightness of the crumb are available. The 'crust unwrap tool' is featured here which also enables the crust thickness to be measured.
Dimensions
Multiple measurements are recorded for each slice including slice area, height, width and packaging dimensions such as a wrapper length.

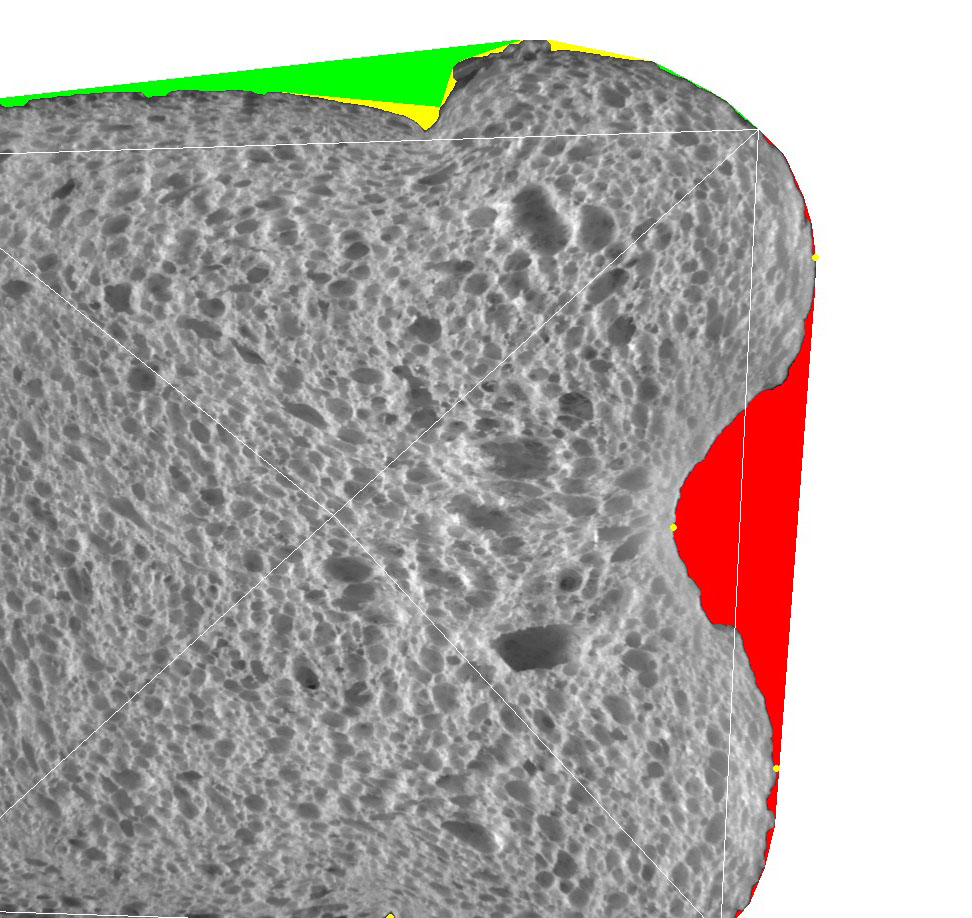
shape
Visual appearance is quantified with shape measurements, such as the Concavity (top, bottom and side), Oven Spring (position, height, depth) and top shoulder and bottom roundness.
BREAD SCORE
As bakers produce different types of product at C-Cell we have developed a scoring system to combine results into one specific score which relates to the sensory assessment of the particular bakery product. Bakeries use this to monitor changes in batch production and identify variability on a daily basis.

Example of Bread Score Software
Cell Size
Individual cell analysis provides detailed information regarding number, size and distribution of cells throughout the crumb structure. Holes, Wall Thickness and Cell Areas & Volumes are quantified.
Elongation
Moulding performance can be monitored through crumb cell elongation measurements. C-Cell gives a visual circulation map showing the axis of elongation and level of curvature of the internal crumb structure in addition to a specific degree of circulation result.