

C-Cell produces over 50 measurements per analysis, these are broken down into the following sub-groups which determine product/ingredient/process quality in research and development projects.
Colour
Dimensions
Shape
Cell Size
Elongation
Inclusions
External features
Many companies select 5-8 results that best differentiates their product quality.
Colour
L*a*b* Colour results are available with C-Cell Advanced. Data such as average crumb colour, Inclusion area, colour and location are available. The 'crust unwrap tool' is featured here which also enables the crust thickness to be measured.
NOTE: inclusion colour measurements use a bespoke calibration developed on the users specific product range.
Dimensions

Multiple measurements are recorded for each slice including slice area, height, width and packaging dimensions such as a wrapper length.
shape
Visual appearance is quantified with shape measurements, such as the Concavity (top, bottom and side), Oven Spring (position, height, depth) and top shoulder and bottom roundness.
Cell Size
Individual cell analysis provides detailed information regarding number, size and distribution of cells throughout the crumb structure. Holes, Wall Thickness and Cell Areas & Volumes are quantified.
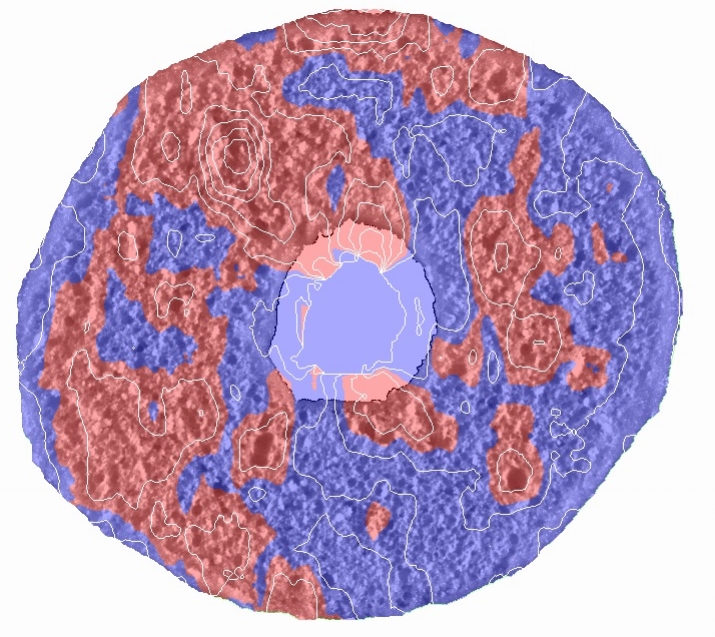
Elongation
Moulding performance can be monitored through crumb cell elongation measurements. C-Cell gives a visual circulation map showing the axis of elongation and level of curvature of the internal crumb structure in addition to a specific degree of circulation result.
Bubble Data
An additional capabilty for research and development applications is a spreadsheet containing the following information on each individual cell found within the image:
Cell Area
X position of cell
Y position of cell
Cell Elongation
Cell Volume