SAMPLE SELECTION
The decision on numbers of individual slices to be assessed for a particular product depends on the circumstances of the test. It is common for the cell structure of bakery products to vary along their length, due to its mechanical processing and the method of baking (tinned/lidded etc). This is especially true for bread and other fermented products which undergo moulding before the dough is placed in the pan.
It is important to have a standard sampling method specific to the type of product in order to gain maximum value from C-Cell data. Data from single or multiple slices from the same product may be taken. If more than one product is available from a given batch, then data may be collected from multiple products per test (e.g. 2-6) and multiple numbers of slices per product (e.g. 4-8) and then averaged using spread sheets
Examples
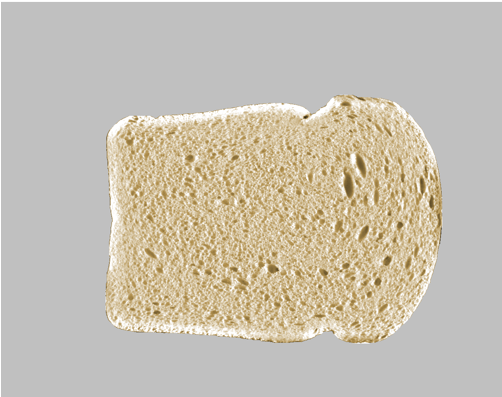
Single piece pan breads
The most common approach is to take a single slice at the approximate centre of each sample. More than one product should be examined where possible.
There is some variation along the length of a single piece loaf which comes from the moulding pattern. An alternative strategy would be to sample a single product at distances of say 25, 50 and 75% of the pan length.
Multi-piece pan breads, and twisted dough breads
There is generally a cyclical variation in the cell structure of multi-piece pan breads. Comparisons between products should be made at the same point along the length of the loaf.
Suggested locations would be in the centre of one or more of the multi pieces and/or at the join of the two pieces.
Twisted dough breads should be sampled at 2 or 3 standard positions along the length of the loaf.
If possible, more than one loaf should be sampled to provide information on between sample variability.
Hearth-type breads
There is greater inherent variability in such products. Measurements at several points along the length of the product are recommended, e.g. two, at 33 and 66% length, or three at 25, 50 and 75% lengths.
Slices which incorporate areas with cuts or marks on the crust will result in greater variability in the data.
To avoid unwanted effects from variations in slice area cell data should be normalised.
Rolls, buns, hamburger buns
Round or cylindrical products may be sampled in vertical or horizontal cross section.
If possible, more than one sample should be tested to provide information on between sample variability.
Cakes
Cakes with a rectangular cross-section and round sponges and small unit cakes are commonly sliced vertically near to the geometric centre of the product.
Multiple samples along the length of a rectangular cross-section cake are recommended, see Pan breads.
Multiple sections may be taken from round cakes but normalising of the cell data must be undertaken to provide meaningful averages.
If possible, more than one sample should be tested to provide information on between sample variability.
Pizza bases
Slice vertically, taking a 12mm strip, and attach to tray with Blue Tack
If possible, more than one sample should be tested to provide information on between sample variability.
Laminated products
Slice vertically.
If possible, more than one sample should be tested to provide information on between sample variability
SAMPLE PREPARATION
Note
Commercially sliced bread will always have a more “uneven” surface appearance when compared to the “perfectly” sliced product due to the constraints of slicing freshly baked bread in a commercial bakery (product temperature and blade sharpness). Analysing the same product prepared on a commercial slicer and a sharp blade slicer (such as Graef Master M 20) will typically produce 12 – 15% more cells for the laboratory sliced product.
This is due to the much smoother surface texture of the laboratory sliced product, which has been cut with a sharp blade producing no tear marks in the product surface, which allows the software to identify more accurately the cell and cell wall divide.
Commercial sliced bread
No preparation required. Ensure slices are removed from same location each time.
Laboratory sliced bread
Sharp knife with guide
Pilot plant commercial slicer
For laboratory preparation, we recommend a fine-toothed slicer similar to:
https://www.amazon.co.uk/gp/product/B00NIO9T8O/ref=oh_aui_detailpage_o05_s00?ie=UTF8&psc=1
The cleaner the surface cut then more reproducible the results will be.
Variations due to sample preparation are the greatest source of error when comparing results
Rolls / Cakes / Pizza base
As for Laboratory sliced
Note - For very soft samples try part freezing the sample before slicing.
CALIBRATION
Monochrome C-Cell
Follow the manufactures instructions, using the single greyscale Munsell card.
Colour C-Cell
Follow the manufactures instructions, using the 2-stage greyscale Munsell and Ramp card.
FIELD OF VIEW / SAMPLE SIZE / ORIENTATION
The filed of view is 7.5” x 5.5” (19cm x 14cm)
The sample being imaged must be placed in the centre of the tray with the tray background (Black, Blue or Green) visible on each side.
The “top crust” must either be towards the top of the image or towards the right and the orientation arrow must align with this.
Adjust the tray level to ensure the slice surface is at the correct level to be analysed.


CONVERTING THE IMAGE INTO DATA
The process followed to convert a digital image into Objective data
• Slice is identified. Small projections are removed, crumbs are ignored.
• Slice size and shape are measured. (Area, height, breadth, concavity…)
• Cells and cell walls are segmented. (Area of cells, brightness, cell contrast, cell wall thickness…)
• Individual cells are measured. In the Advanced Edition, measurements for each cell can be output (Area, position, elongation, volume).
• Size statistics are calculated. (Cell diameter…)
• Spatial distribution is calculated. (Curvature, net cell elongation, clustering…)
DATA PRESENTATION
C-Cell measurements are grouped as follows:
Dimensions
Slice Area
Slice Height (max)
Slice Height (avg)
Breadth (Width)
Height/Breadth
Wrapper length
Colour / Brightness
Slice brightness
Cell contrast
Crumb colour (L*a*b*)
Crust colour (L*a*b*)
Crust thickness characteristics
Shape attributes
Total concavity
Top concavity
Left concavity
Right concavity
Bottom concavity
Top left shoulder
Top right shoulder
Left break
Right break
Left break height
Right break height
Left break depth
Right break depth
Left break position
Right break position
Bottom left roundness
Bottom right roundness
Cell information
Number of cells
Number of holes
Area of cells
Area of holes
Cell diameter
Cell volume
Coarse cell volume
Volume of holes
Cell volume (map)
Cell vol range (map)
Relative vol range (map)
Coarse / Fine clustering
Wall thickness
Non-uniformity
Cell elongation and orientation
Average cell elongation
Net cell elongation
Cell angle to vertical
Cell alignment
Vertical elongation
Degree of circulation
Circulation horizontal offset
Circulation vert offset
Curvature
ADDITIONAL DATA (Optional features)
Bread score
Bespoke calibration – specific to product type
Inclusions / External features
Number of features
Area occupied
Colour (L*a*b*)
XY location of each feature
Uniformity of distribution over surface
IMAGES CREATED IN SOFTWARE
MONOCHROMER CAMERA
The unprocessed raw image taken by the monochrome camera

COLOUR CAMERA
The unprocessed side lit colour images taken by the colour camera

COLOUR CAMERA
Side lit colour to monochrome conversion

The side lit colour image is converted to a monochrome format to allow data processing by monochrome algoritms.
Colour camera
Top lit images

Top lit colour images used to determine crumb and crust colour parameters.
PROCESSED IMAGES
Cell image

Cells and cell walls are identified, Cell walls are colour coded black and the cells are blue. The darker the blue colour, the smaller the cell diameter. The smallest cell we can measure is 0.14mm. Cell size increases as the shading gets lighter. Any large holes are circled in red.
Volume map image

The Volume map image divides the cells within the image into course and fine regions of cell texture, using the median value to separate each section.
Brightness image
The brightness image shows the average grey level of all of the pixels in the slice.
Crumb structure and bran content influence this measurement. In most cases, a finer crumb structure will give a brighter slice brightness when comparing an open structured bread (such as baguette) and a fine structured sandwich bread made with the same flour. The image shown is adjusted to constant brightness to allow comparison of different samples.
Shape image

The Shape information is of primary importance to tinned (and lidded) loaves that will be placed in packaging prior to sale. The image shows a view of the slice with particular shape features shown in colour. A white rectangular box is shown enclosing the slice. Measurements of cell position (available in the Advanced Edition) are made within the coordinate system defined by this box, and measurements of slice Height (max) and Breadth are given by the dimensions of the box. The corners of the slice are also identified and connected by white lines to each other and to the centre of the slice. Concavities in the sides of the slice are shown in blue for the bottom, green for the sides and red for the top. Where oven spring is detected, this is shown in yellow. The points used for measuring the slice height are marked as yellow points on the top edge. High points are identified at either side of the top edge and the lowest point between them is also marked. Where there is no clear dip in the top, some of these points may coincide and it may not be possible to see three distinct points
Elongation image

The elongation image characterises key properties introduced into the dough during the moulding / sheeting process. It represents the orientation and elongation of cells. Short red lines are drawn parallel to the long axis of cells at each point in the slice. The length of the lines indicates the degree of elongation of the cells. For regions that show some curvature, green lines are also drawn that point towards the centre of the curvature. The length of the green lines indicates the degree of local curvature. Yellow lines are also shown that divide regions of the slice that show curvature in opposite directions. Regions of the slice that show a complete 360 degree rotational structure are shaded in bright blue. Those that show a rotational structure that turns through 180 degrees are shaded in pale blue. Those showing no full rotation are left in grey.